Election Jitters - October 2025
KATE WOLLMAN-MAHAN

Dear friends,
I wanted to look closely at the issue on everyone’s mind – the NYC mayor’s election and more specifically, the near inevitability of our next mayor being Zohran Mamdani. This election has the business and real estate communities on edge, as well as both buyers and sellers. There is no doubt that if Mamdani wins, we expect investor confidence to decline, at least initially. While it feels unsettling, we have been here before. In 2013 CNBC asked, “Will Mayor-elect Bill de Blasio Kill NYC Real Estate?” When Mayor Bloomberg was first elected in 2002, pundits were predicting the mass exodus of high earners from the city, in articles with titles like “Bloomberg to City: Drop Dead.”
I created the following charts to better understand how our past mayors have affected real estate sales and pricing. The first graph below shows the median pricing of Manhattan closed sales going back to 2002. I have overlaid the major financial events as well as the last three mayoral administrations from these years: Bloomberg, De Blasio, and Adams. The graph shows that the NYC market is remarkably consistent and is actually more reactive to broader economic events than to local politics. While Bloomberg is widely regarded as the most pro-business mayor, median pricing actually increased at a steadier pace under de Blasio, despite the pandemic, and held pretty steady under Adams, despite the rising interest rates and the indictment for corruption of Adams and multiple members of his administration.
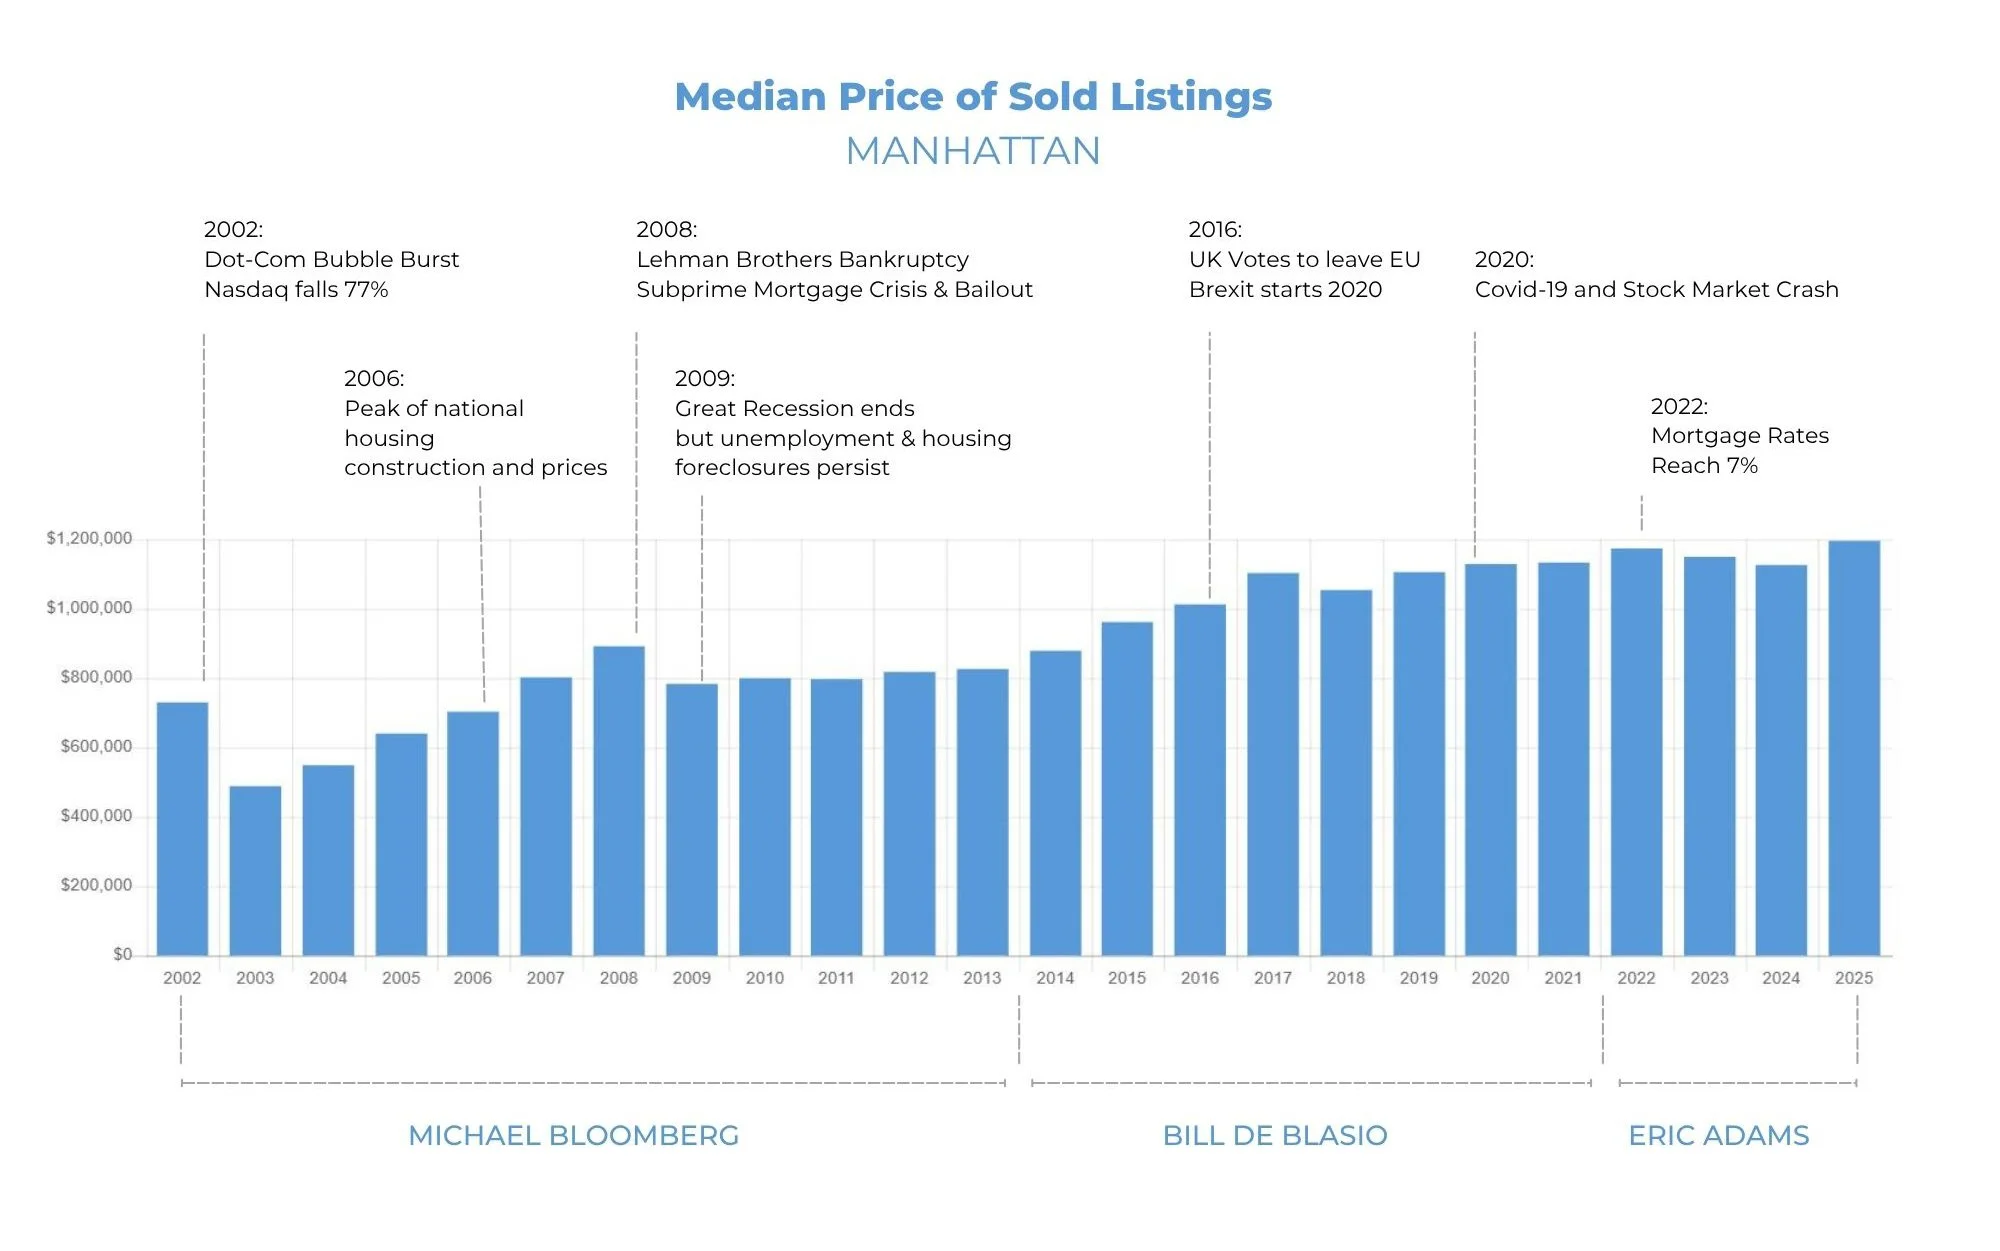
While the city can withstand an unpopular administration, it could be argued that strong local leadership can mitigate the effects of large market swings. Bloomberg led during a period of economic uncertainty nationally. Pricing dropped precipitously twice, first in 2002 (the Dot-Com bubble burst with Nasdaq falling over 75%) and again in 2008 (the collapse of Lehman Brothers and the sub-prime mortgage crisis). Yet both times, within one year, it was back on track for year over year gains. The New York Comptroller’s report from 2009 speaks to the relative stability of the New York market. Nationwide, home prices dropped between 30 and 50% between 2006 and 2009, while the Dow Jones fell almost 54% from its peak. Meanwhile in New York City, the decline in home prices did not exceed 21% - even though the city and state were projected to lose $3.5 billion from 2008 to 2010! The city recovered, and in fact housing pricing was so expensive that Bloomberg’s successor capitalized on the middle class leaving for the suburbs, campaigning on “Our middle class isn't just shrinking; it's in danger of vanishing altogether.”
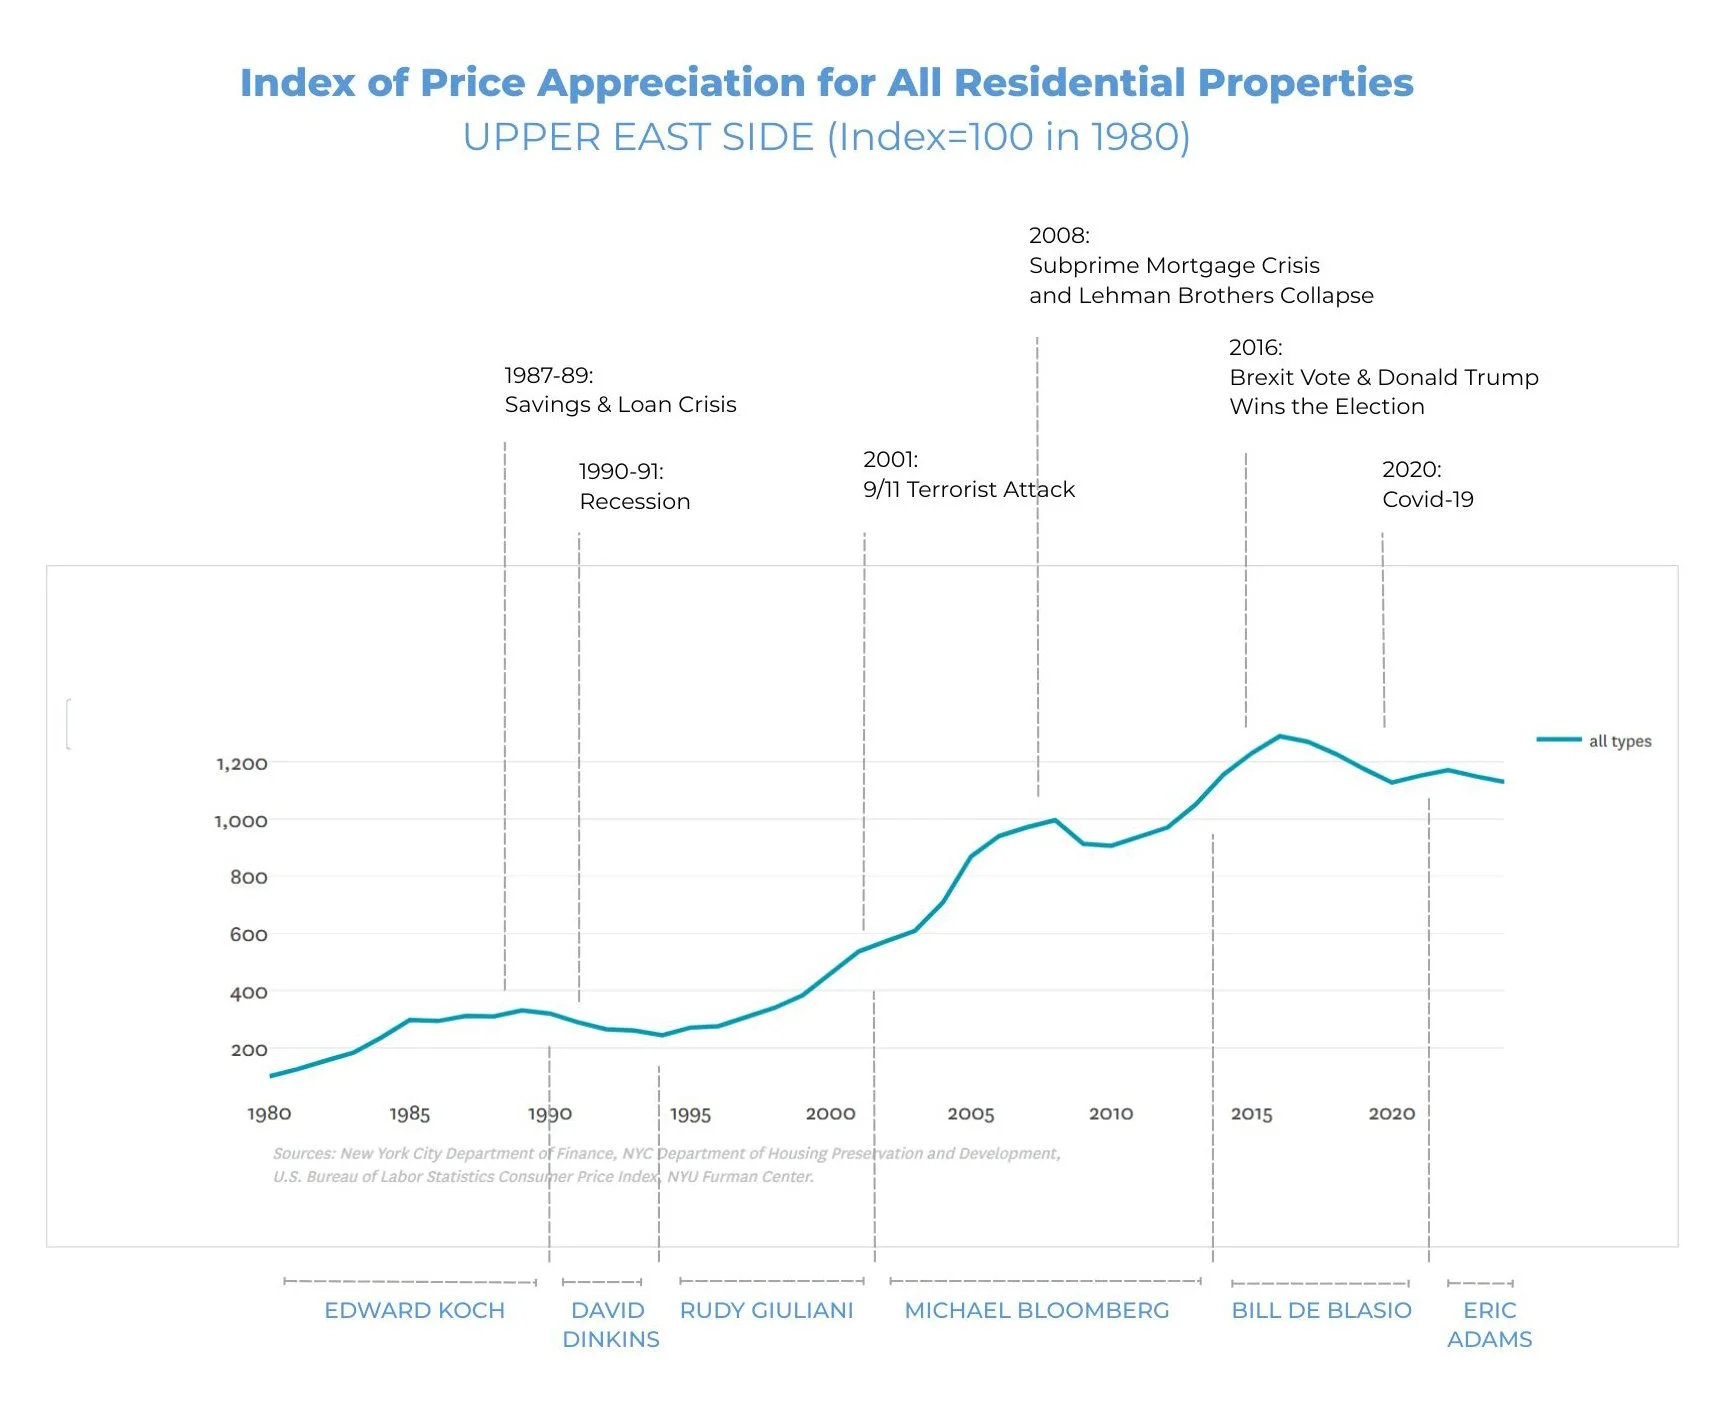
Going back a little further, the State of Homeowners and their Homes (a 2024 report by the New York Department of Finance and the NYU Furman Center) shows the Index of Price Appreciation over a longer period of time. Again, I overlaid the major financial events as well as the previous administrations from these years. This chart, showing price appreciation of properties on the Upper East Side, captures more short term volatility, but consistent long term appreciation, between 1980 (Edward Koch was mayor) and the present. Pricing on the Upper East Side declined under the Dinkins administration and the De Blasio administration, corresponding with the 1990 recession and the pandemic and rising rates. Yet over longer periods of time values increase consistently.
The Manhattan homeownership rate is only about 25% and has not contracted over the past decade. This reflects the fact that owning in Manhattan is out of reach for many New Yorkers, who are then subject to the incredibly expensive rental market. For those who can afford to purchase, they should remember that uncertainty presents opportunities. If you can buy when confidence is low, you will have a wider margin to sell when you want to, not when the market incentives you.
For now, if consumers are truly concerned about the future of New York, it is not reflected in their behavior. 3rd Q 2025 numbers show 5% growth in the number of closed sales year over year, with a 7% increase in median price. Notably the strongest increase in closed sales were in the $3-5M range and the $10M+ range. From 9-11 to Lehman Brothers, Dinkins to de Blasio to our upcoming mayor, New York is resilient, and remains in demand for buyers from all over the world.